
Figure 4.
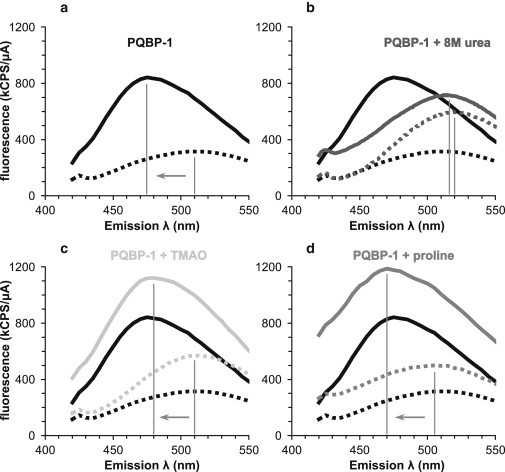
ANS fluorescence spectroscopy of PQBP-1. Each set of measurements consists of two spectra, one with ANS and buffer only (dashed line) and the other with ANS, buffer, and PQBP-1 (solid line). (a and b) Spectra in the (a) native condition (PBS, black lines) and (b) denaturing condition (8 M urea, dark gray lines). (c and d) Spectra with osmolytes in PBS: with (c) 1 M TMAO (light gray lines) and (d) with 1 M proline (gray lines). The peak of each spectrum is identified with a vertical line, and the blue shift caused by PQBP-1 is indicated by an arrow. Spectra in the native condition (black lines) are shown for comparison in all panels.