
Figure 1.
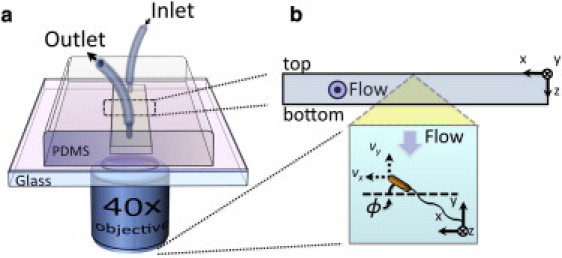
Experimental setup. (a) WT E. coli were subjected to various shear flows within a microfluidic channel and imaged from below in an inverted microscope setup. (b) Cells were observed at the center of the channel ceiling as they swam over its PDMS surface. In choosing a coordinate system for data analysis, we follow the convention of Kaya and Koser (19), where the +y axis points upstream and the z axis denotes the surface normal (for channel ceiling) pointing into the flow channel. In this convention, a positive y velocity component corresponds to upstream migration. The cell body orientation angle (ϕ) is measured relative to the +x axis. The microscope-camera system flips the images along the vertical image axis, such that the z axis points into the page in recorded pictures (see Fig. 3).