
Figure 6.
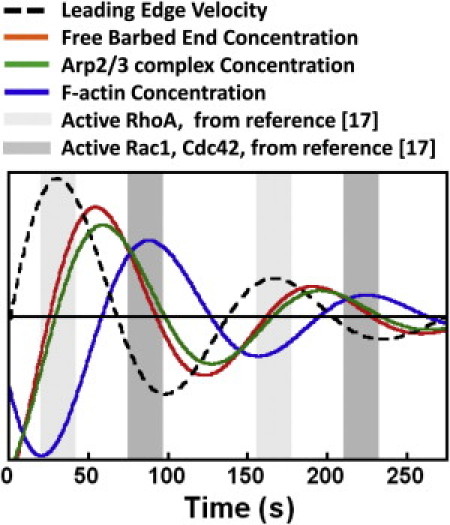
Temporal coordination of leading-edge velocity, with free barbed end, Arp2/3 complex, and F-actin concentrations (integrated over a 5-μm band). Curves for free barbed ends and F-actin were generated from the model by perturbing the system from its steady state and allowing it to relax without noise. Perturbations without noise result in underdamped oscillations with period τ = 135 s. Spikes in free barbed end concentration lead spikes in F-actin by 33 s. Leading-edge velocity and Arp2/3 complex concentration signals were manually added at the appropriate temporal offset with respect to F-actin (in Fig. 2A, the leading-edge velocity is 0.85 τ out of phase with F-actin; in Fig. 4 spikes in Arp2/3 complex concentration precede spikes in F-actin concentration by ∼0.2 τ). Previous measurements (17) suggest that a peak in RhoA activation accompanies peaks in leading-edge velocity (light-shaded background). The same study found that peaks in Rac1 and Cdc42 activation occurred at ∼0.4 τ after the RhoA activation peak (17) (dark-shaded background).