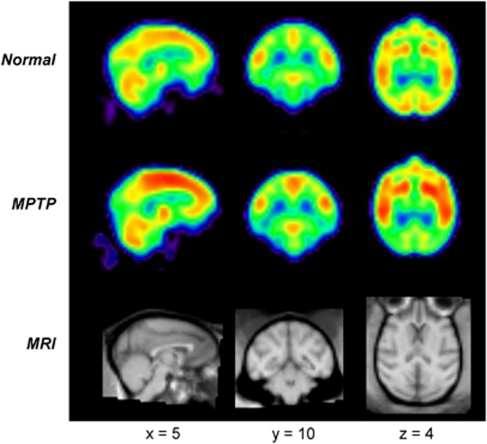
Figure 2.
Mean images of relative cerebral glucose metabolism in healthy and parkinsonian macaques acquired using a high-resolution positron emission tomography (PET) instrument (see text). The regional distribution of radiotracer uptake was highly symmetrical in scans from normal (top) and parkinsonian (middle) macaques. (Each image was obtained by averaging the [18F]fluorodeoxyglucose (FDG) PET scans from each group following spatial registration to a standard brain template (Black et al, 2001). The PET images were compared with magnetic resonance imaging scans (bottom) registered to the same anatomical space.)

