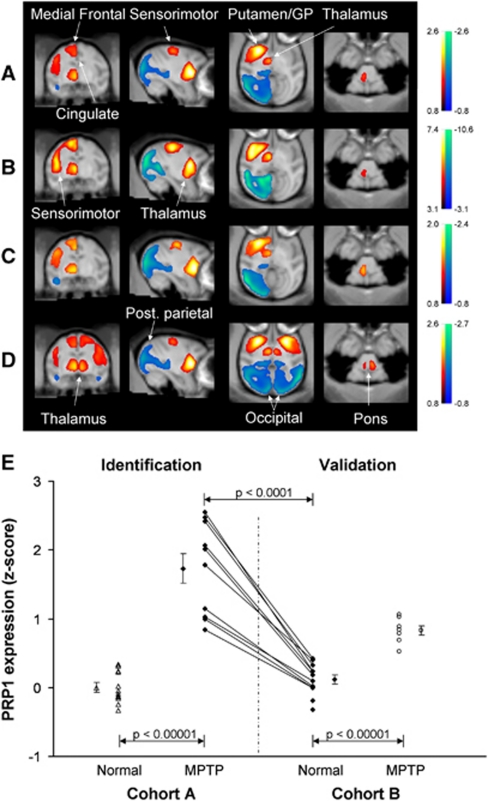
Figure 3.
Abnormal metabolic covariance patterns associated with experimental parkinsonism. (A) Voxel-based spatial covariance analysis of high-resolution [18F]fluorodeoxyglucose (FDG) positron emission tomography (PET) images from five parkinsonian and six healthy macaques (Cohort A). Hemispheric analysis revealed a spatial covariance pattern (PRP1) characterized by increased metabolic activity (red–yellow) in the putamen and globus pallidus (GP), thalamus, pons, medial frontal/cingulate areas, and sensorimotor cortex, as well as relative reductions (blue–green) in the posterior parietal-occipital cortex. (B) Reliability of PRP1 at each voxel according to a bootstrapping estimation procedure (Habeck and Stern, 2010). This map of inverse coefficient of variation (ICV) was thresholded at ICV=3.09 (P=0.001). (C) Abnormal metabolic covariance pattern (PRP2) from the hemispheres of the five monkeys scanned before and after chronic 1-methyl-4-phenyl-1,2,3,6-tetrahydropyridine (MPTP) administration. (D) Candidate whole-brain PRP topography (PRP5) identified over the entire image volume of FDG PET scans from the MPTP-lesioned and normal monkeys included in Cohort A. There was a high degree of topographic similarity between patterns identified using either the hemispheric or the whole-brain spatial covariance approach. (E) Network activity of the hemispheric PRP (PRP1) in individual hemispheres discriminated MPTP animals and normal controls in the derivation sample (P<0.00001). In the validation sample, network activity computed prospectively also separated (P<0.00001) MPTP and control animals. Pattern expression in the MPTP-lesioned animals in the validation sample was lower than those used for pattern derivation (P=0.002), consistent with the difference in motor severity ratings for the two groups (see text). Compared with preMPTP baseline, network activity increased significantly (P<0.0001) in the five parkinsonian animals in the derivation sample who subsequently underwent MPTP lesioning. (Maps of PRP voxel weights and ICV values were displayed on a standard magnetic resonance imaging brain template. Error bars in the graph refer to the standard error of the mean.) PRP, parkinsonism-related pattern.

