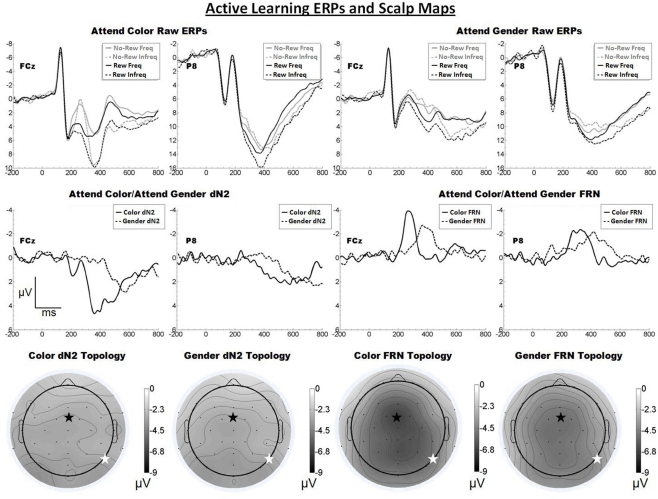
Figure 3.
Grand average ERPs for Experiment 2, recorded from channel FCz and P8 (see labels) and scalp distributions associated with the difference waves. The top row shows the “raw” ERPs for each of the frequency by reward conditions across tasks and electrodes. The middle row shows the dN2 and FRN difference waves across task and electrodes. The bottom row shows the scalp distributions of the dN2 and FRN across tasks. The scalp distributions reflect the base-to-peak measure of each of the dN2 and FRN. The black star on the scalp map denotes channel FCz, and the white star denotes P8. Note that negative is plotted up.

