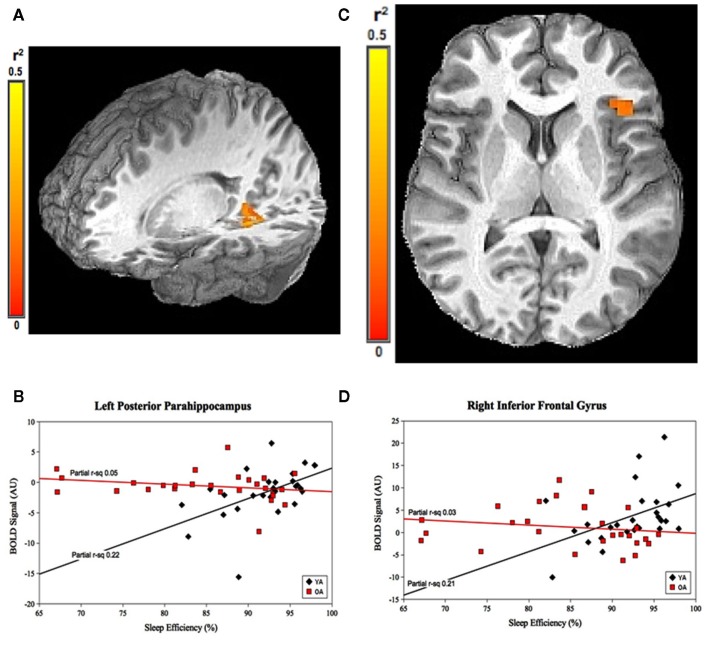
Figure 2.
Group-by-prior sleep interaction for SE. Left posterior parahippocampal gyrus and right inferior frontal gyrus regions showing group-by-SE interaction. (A,C) Color scale represents r2 associated with the interaction term in the statistical model (max r2 = 0.5). (B,D) Graphs show a strong, positive SE–BOLD correlation for the YOUNG (both p < 0.05), with no significant correlation for the OLD (both p > 0.05). (Effect sizes are partial r2 for OLD and YOUNG separately, accounting for the effects of performance.)

