
Figure 9.
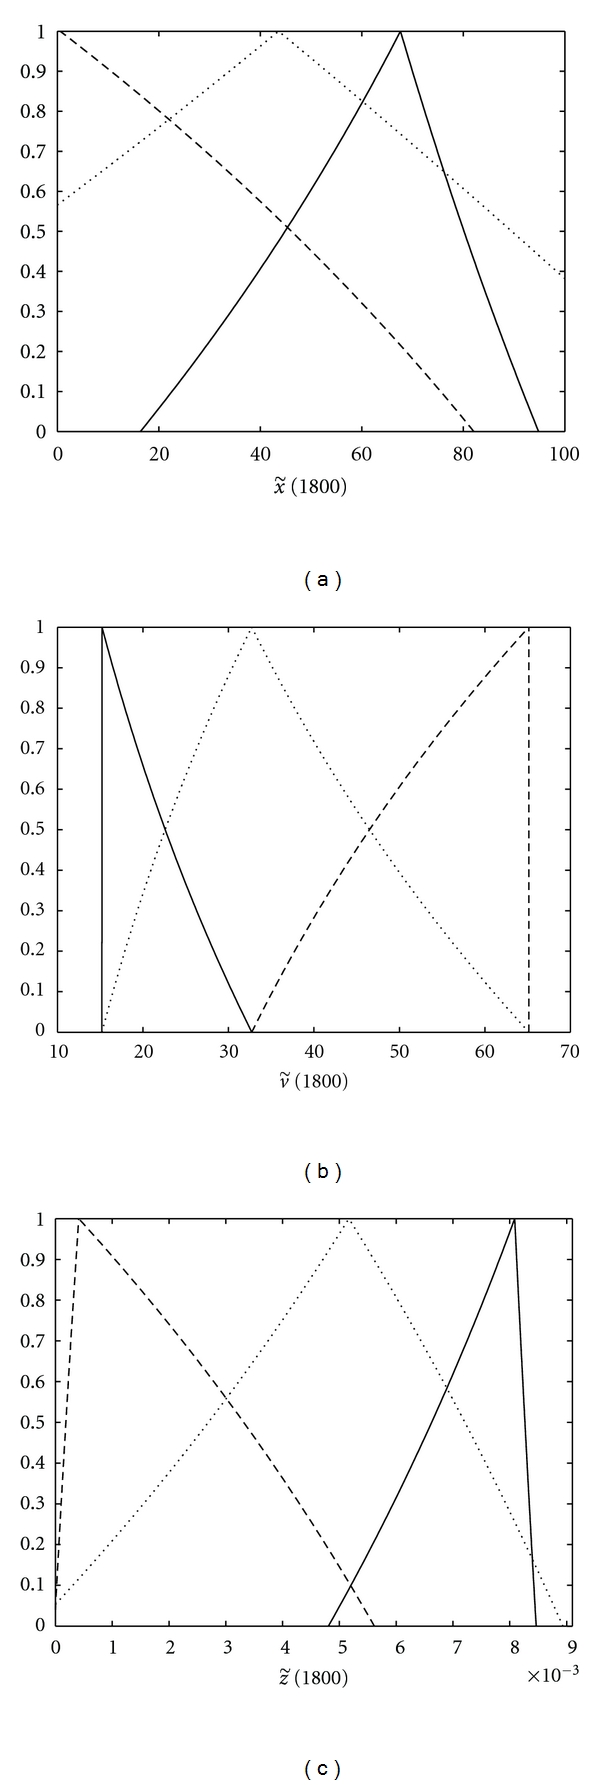
The fuzzy numbers indicating CD4+ T-cells level (a), the viral load (b), and CTLs level (c) on the 1800th day in patients W (- -), M (⋯) and, S (—).
Official websites use .gov
A
.gov website belongs to an official
government organization in the United States.
Secure .gov websites use HTTPS
A lock (
) or https:// means you've safely
connected to the .gov website. Share sensitive
information only on official, secure websites.
The fuzzy numbers indicating CD4+ T-cells level (a), the viral load (b), and CTLs level (c) on the 1800th day in patients W (- -), M (⋯) and, S (—).