Figure 2.
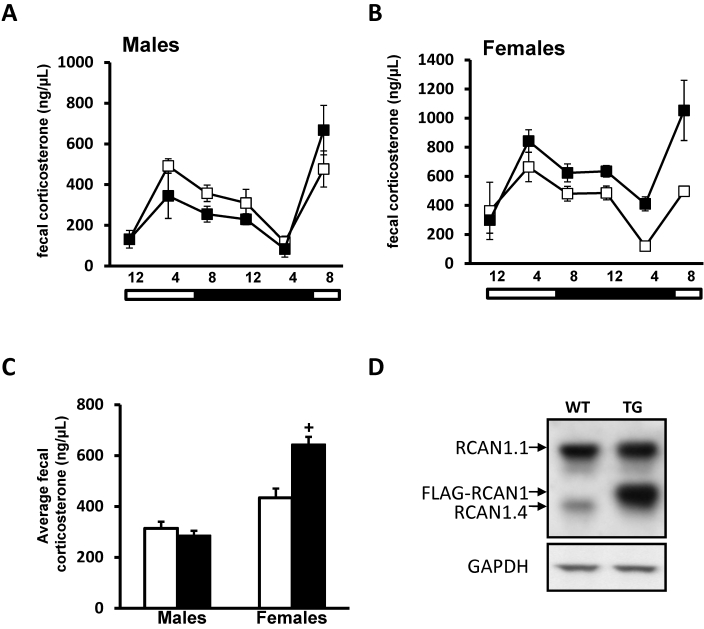
Fecal corticosterone metabolite concentrations (mean ± SEM) in transgenic mutant mice overexpressing RCAN1 in the forebrain. (A) Wildtype (n = 7; open squares) and RCAN1-overexpressing (n = 5; filled squares) male mice show identical patterns of fecal corticosterone exretion over a 24-h collection period. (B) Wildtype (n = 6; open squares) and RCAN1-overexpressing (n = 4; filled squares) female mice show identical patterns of fecal corticosterone shedding over a 24-h collection period. Female mice of either genotype display significantly (P < 0.05 for both sex and time) elevated corticosterone levels compared with male mice of the same genotype. (C) Transgenic female RCAN1 mice display approximately 70% greater (+, P = 0.0021) levels of average corticosterone expression over the 24-h collection period than do wildtype female mice. Bars at the bottoms of panels A through C indicate the lights-on (open) and lights-off (filled) portions of the photoperiod. (D) RCAN1 expression in the brains of genetically manipulated RCAN mouse mutants. RCAN1 is expressed as 2 isoforms in the rodent brain, RCAN1.1 (approximately 38 kDa) and RCAN1.4 (approximately 28 kDa). Overexpression of a FLAG-tagged isoform of RCAN1.1 by using the nse–CRE driver line (TG); note the band runs slightly higher than endogenous 1.4 because of the presence of the FLAG epitope. RCAN1 overexpression is strongly evident compared with that in a non-nse–CRE-expressing control (WT). GAPDH is included as a loading control.

