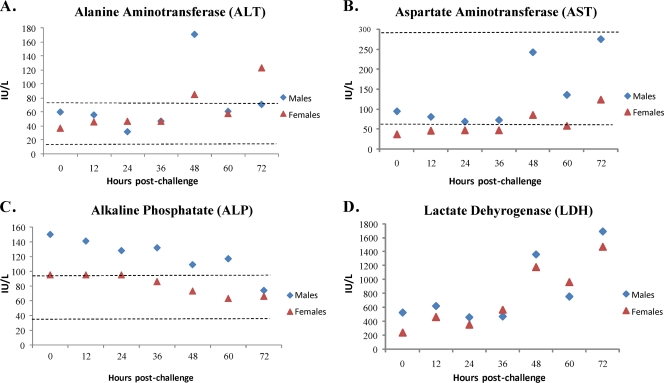
Fig 1.
Data presented are results of clinical chemistry evaluations performed on serum samples pooled (n = 10) by sex at each collection time point along with the normal ranges (dotted lines), when available (41). Time zero represents baseline values determined from mice in group 7 and are shown in Table 1. (A) Alanine aminotransferase; (B) aspartate aminotransferase; (C) alkaline phosphate; and (D) lactate dehydrogenase. Diamonds, males; triangles, females.

