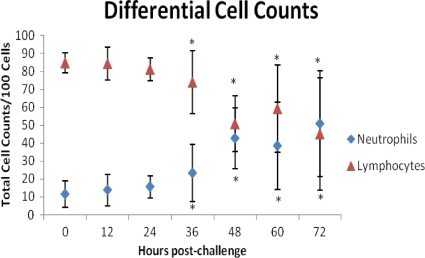
Fig 2.
Data presented are averages from individual results (n = 10, both sexes) of manual differential counts of neutrophils and lymphocytes. Time zero represents baseline values determined from mice in group 7 and are shown in Table 1. Error bars represent standard deviations. Diamonds, neutrophils; triangles, lymphocytes. An asterisk indicates a statistically significant (P < 0.05) increase in neutrophils and a concurrent statistically significant (P < 0.05) decrease in lymphocytes from baseline values.

