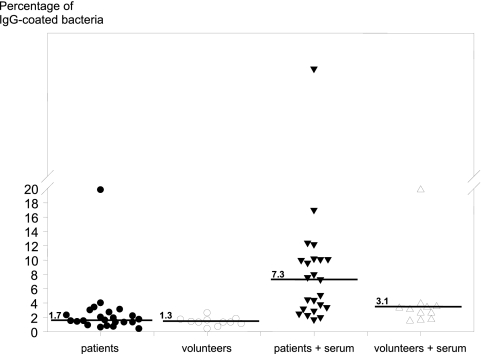
Fig 1.
Flow cytometry analysis of fecal samples from CD patients and healthy volunteers. Each symbol represents a patient or volunteer. The percentages of IgG-coated fecal bacteria for the four different groups (solid circles, in vivo IgG coating patients; open circles, in vivo IgG coating volunteers; solid triangles, patient samples after autologous-serum incubation; open triangles, volunteer samples after autologous-serum incubation). The lines represent the medians of the groups.

