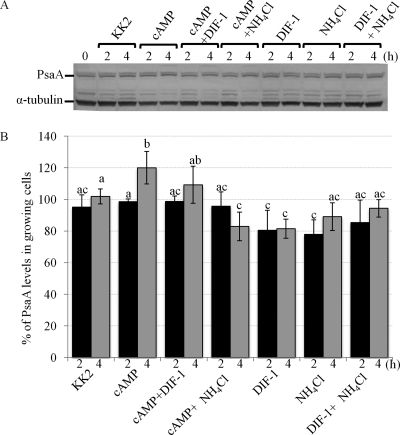
Fig 9.
The effect of developmental morphogens on PsaA expression. Cells were starved (in KK2) for 2 to 4 h in the presence or absence of cAMP, DIF-1, NH4Cl, or any two in combination. (A) Western blot showing PsaA and α-tubulin expression in treated cells. (B) The quantification of band intensities from Western blot in panel A (mean + SD). A two-way ANOVA with Tukey's test was used to analyze changes in band intensities. Different treatments were compared at each time point, and different time points were compared within each treatment. Groups that do not share a letter are statistically different (P value ≤ 0.05). This experiment was independently replicated 4 times.

