Fig 10.
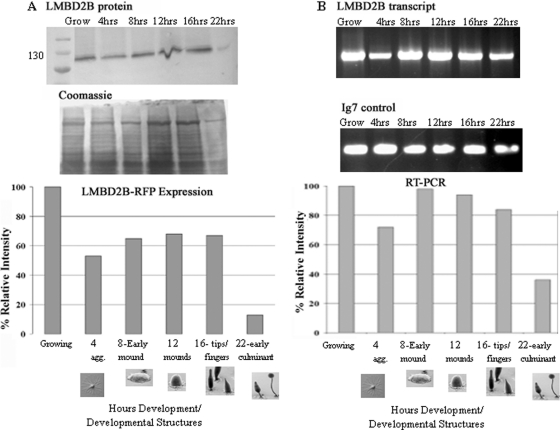
LMBD2B protein and mRNA are expressed throughout growth and development. Analysis of LMBD2B-mRFP protein expression (A) and RT-PCR with relative levels of lmbd2B transcript (B) are shown. (A) During growth and after the indicated number of hours of development, cells were washed, harvested, and run on an SDS-6% PAGE gel. (Top) After transfer, nitrocellulose was probed with an RFP antibody. The LMBD2B-mRFP product is about 116 kDa. (Bottom) Coomassie stain was used to correct quantification for unequal loading. (B) At specific time points, the RNA from the developing structures was isolated. A cDNA copy of total RNA was used for PCR. lmbd2B-specific primers were used to amplify the transcript levels in the cells. (Top) Agarose gels of the RT-PCR product of LMBD2B transcripts and Ig7 control transcripts. (Bottom) Calculation of the relative intensity of each band. The developmental pictures are from http://dictybase.org (copyright, M. J. Grimson and R. L. Blanton, Biological Sciences Electron Microscopy Laboratory, Texas Tech University; reported with permission).

