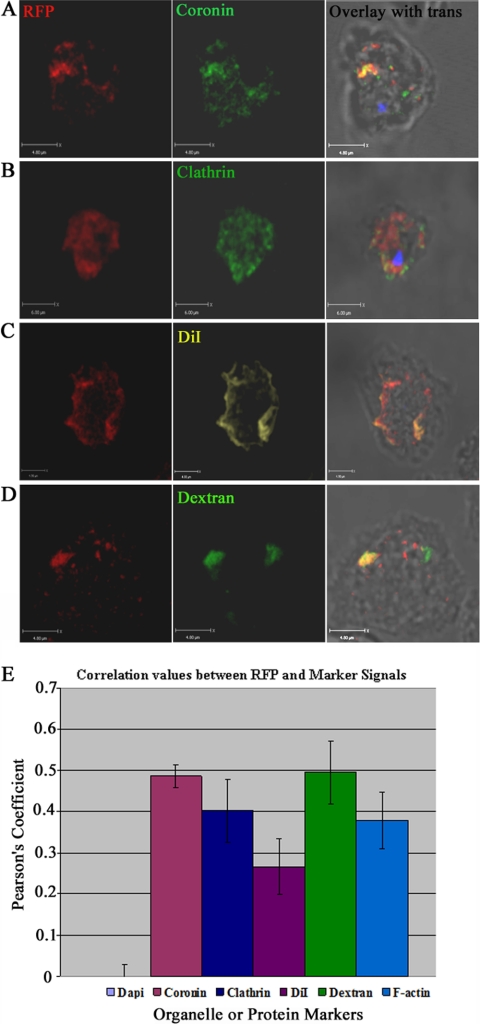
Fig 5.
Colocalization of LMBD2B with endocytic and membrane markers. Growing cells were placed on a coverslip, fixed, and stained. Images of LMBD2B-mRFP indirect immunofluorescence are displayed on the left, other protein markers in the center, and overlays with transmitted light images on the right. (A) Coronin Ab. (B) Clathrin Ab. (C) DiI. (D) FITC-dextran. LMBD2B fluorescence is indicated by the red signal. All images are Z-axis slices through a cell. Blue signal indicates nuclei stained with DAPI. Yellow/orange signal indicates colocalization. (E) Values of colocalization. A positive correlation is indicated by a positive Pearson's coefficient. Colocalization of LMBD2B with DAPI was used as a negative control, since there should be no colocalization, so the value would represent 0 correlation. n > 30 cells from at least 2 rounds of fixations. The error bars indicate standard errors.

