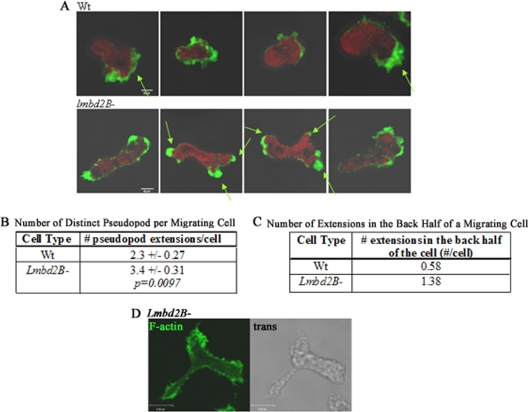
Fig 8.
Multiple pseudopodial extensions in LMBD2B-null cells. Growing cells were forced to undergo migration by spotting folic acid near a drop of cells on coverslips. The cells were stained with Alexa Fluor 488-phalloidin to label F-actin. (A) Z-axis slices of WT and lmbd2B− cells. Polymerized actin is green, and red represents G-actin. The arrows point to distinct areas of F-actin pseudopodial extensions. (B) The number of distinct pseudopods per cell was calculated. lmbd2B− cells have on average one extra pseudopod per migrating cell compared to WT cells. n > 8 cells from 3 separate phalloidin staining experiments. (C) Results of counting actin-rich extensions in the rear of the migrating cells. lmbd2B− cells have more pseudopods forming in the back half of a chemotaxing cell than WT cells. n > 12 cells from 3 separate phalloidin staining experiments. (D) Same as panel A but showing an actin-rich pseudopodial extension from the middle of an lmbd2B− cell; a Z-axis slice of an F-actin fluorescent staining and a transmitted image are displayed.

