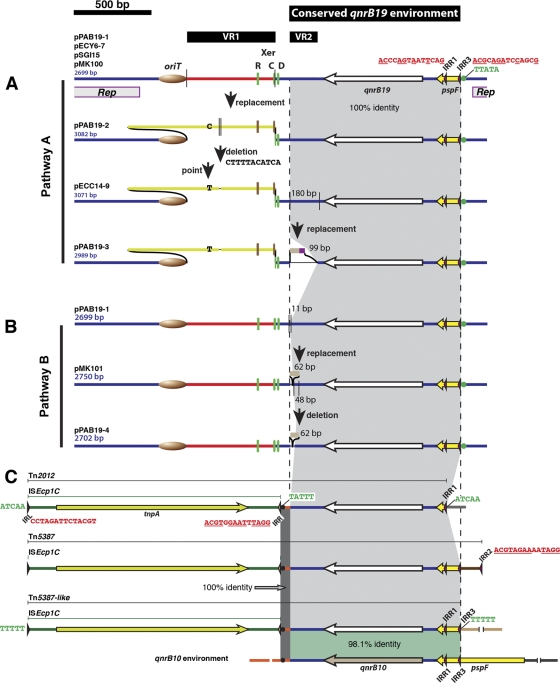
Fig 1.
Comparative diagram of qnrB19-harboring elements. Colors indicate identical nucleotide sequences. For the sake of clarity, in two regions across the different elements a gray shading was added to indicate the portions with identical sequences. In the case of the qnrB10 environment, a green shading was added to show the 98.1 identity region. Variable regions VR1 and VR2, as well as the conserved qnrB19 environment, are indicated by black bars at the top of the genetic maps. The thin vertical lines in the plasmid maps indicate the edges of the DNA fragments replaced or deleted in each rearrangement. The Xer recombination sites components are indicated as follows: R, ARG box (Arg-binding region); C, XerC-binding site; D, XerD-binding site. The different colors of XerC, XerD, and ArgR binding sites indicate that they have different sequences. The oriT is indicated as a brown oval. IRL, IRR, IRR1, IRR2, and IRR3 are indicated by slender arrowheads, and their sequences are shown in red (underlined nucleotides correspond to a perfect reverse complement of the IRL sequence). The target site duplications of ISEcp1C or ISEcp1C-based transposons are shown in green (the TTATA sequence after IRR3 in the different plasmids and the TATTT after IRR in the transposons are emphasized by green and black dots, respectively). The location of the replication region (Rep) of all plasmids is shown below the pPAB19-1 genetic map.

