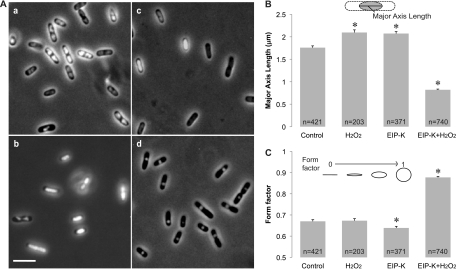
Fig 1.
DNA condensation in E. coli MC4100. (A) Light micrographs of DNA condensation under different treatments. (a) Control (ddH2O, used as a solvent in the other treatments); (b) 3 mM H2O2; (c) 13.75 mM EIP-K; (d) 13.75 mM EIP-K plus 3 mM H2O2. Cells were stained with Hoechst to label DNA, and images were taken by simultaneously presenting UV and transmitted light. Scale bar, 5 μm. (B and C) Quantification of DNA condensation using the length of the major axis of the nucleoid (B) and the form factor, where 1.0 is a perfect circle and 0.0 is a straight line (C). The treatments in panels B and C were the same as in panel A. The values are means and standard errors of the mean (SEM), and the number of cells (n) used for each treatment is shown in the bar. The asterisks indicate that treatments are significantly different from the control. In panel B, there is a significant treatment effect (one-way ANOVA; F[3,1731] = 389.17; P < 0.001), and post hoc Scheffé tests (α [level of significance] = 0.05) show that (H2O2) = (EIP-K) > (control) > (EIP-K plus H2O2). In panel C, there is a significant treatment effect (one-way ANOVA; F[3,1731] = 355.01; P < 0.001), and post hoc Scheffé tests (α = 0.05) show that all treatments differ from each other, except the control and H2O2.

