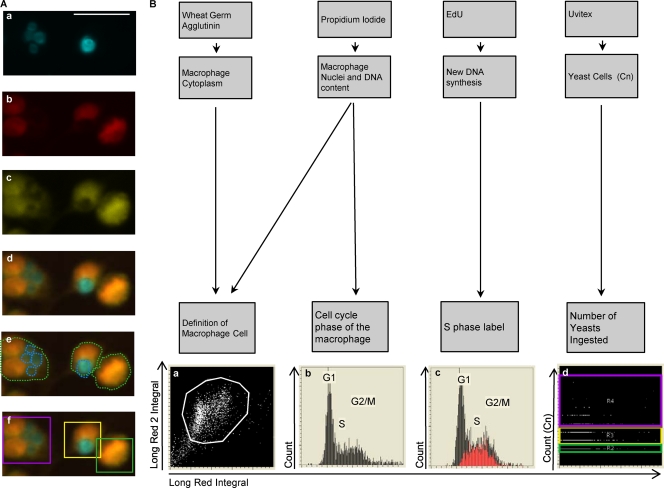
Fig 1.
Quantification of phagocytosis and cell cycle phase in macrophages by LSC. (A) Phagocytic quantification. Fluorescence images of Uvitex-stained C. neoformans (Cn) (a), PI-stained nuclei (b), WGA-stained cytoplasm (c), and merged Uvitex, PI, and WGA (d) are shown. (e and f) Contours encircling fluorescent areas (light green line) define the macrophage area, and contours encircling Uvitex signal define the C. neoformans area (cyan line) (e); the C. neoformans yeast (C. neoformans) subcontours inside each macrophage are also quantified (f). Categories were created and translated into color-coded boxes—no C. neoformans, green; 1 to 2 C. neoformans, yellow; and >3 C. neoformans, magenta—allowing verification of the software identification. Scale bar, 20 μm. (B) Cell cycle status and correlation with phagocytosis. The association of different fluorescent markers allowed the identification of macrophages and study of intracellular events within each macrophage. Macrophages were classified according to the number of yeasts that they had ingested and then subclassified according to their cell cycle phases. (a) Cytoplasmic signal and nuclear signals were merged to delineate the macrophage and define the macrophage population (white box). (b) PI staining quantifies the amount of DNA, producing a histogram with three regions that reflected the cell cycle stage, i.e., the G1, S, and G2/M phase. (c) EdU labeling (Red) identifies cells actively synthesizing DNA (S phase). (d) The number of C. neoformans events inside each macrophage was plotted and divided into three categories: no C. neoformans, green; 1 to 2 C. neoformans, yellow; and >3 C. neoformans, magenta. The experiment was performed with primary macrophages infected with C. neoformans strain H99 at an MOI of 1:2.

