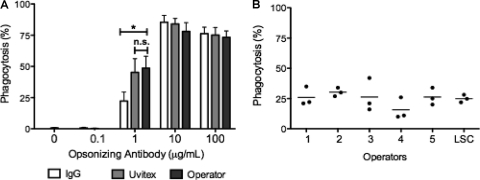
Fig 2.
Comparison of LSC staining strategies with reference methods. LSC quantification correlated with human operator quantification of a Giemsa-stained preparation. (A) The BMDM phagocytic rate was detected by LSC by staining with a fluorescence-labeled antibody against the opsonizing antibody and simultaneously by Uvitex cell wall staining. The same preparations were subsequently stained with Giemsa stain and quantified by a human operator. The experiment was performed twice counting triplicate wells. Means ± the standard deviations (SD) of triplicate wells of a representative experiment are shown. Two-tailed t test with a 95% confidence interval (*, P < 0.01; n.s., not significant). (B) Human operator quantification was compared to LSC in J774.16 macrophages. Triplicate wells were analyzed by LSC and subsequently stained by Giemsa and quantified by five independent human operators. The operators were blind to the conditions of the assay. The pperators were instructed to choose 50% confluent fields but were left free to define their fields of analysis. Means ± the SD of triplicate wells are shown. Groups were compared using one-way analysis of variance. P = 0.04 with a 95% confidence interval.

