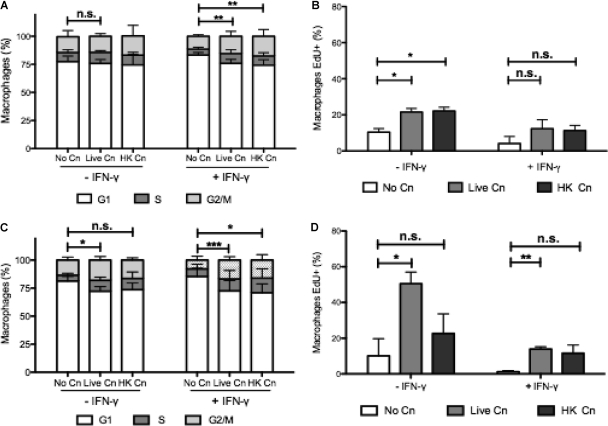
Fig 5.
Progression in cell cycle and new DNA synthesis in BMDM. BMDM progressed into S phase, as demonstrated by cell cycle analysis and EdU incorporation, when C. neoformans was ingested. (A) Cell cycle plot after 6 h of phagocytosis. (B) Incorporation of EdU after 6 h of phagocytosis. (C) Cell cycle plot after 24 h of phagocytosis. (D) Incorporation of EdU 24 h after phagocytosis. Macrophages were infected with live and HK C. neoformans (indicated as Live Cn and HK Cn, respectively) for 6 or 24 h, and EdU was added in the last 6 h of the experiment. Phagocytosis occurred in the presence of growth factors, with or without IFN-γ (to induce cell cycle arrest in G1 phase). The experiment was repeated four times using triplicate wells. Shown are means ± the SD of triplicate wells of two experiments. Groups were compared using a two-tailed t test with a 95% confidence interval (***, P < 0.001; **, P < 0.01; *, P < 0.05; n.s., not significant).

