Fig 5.
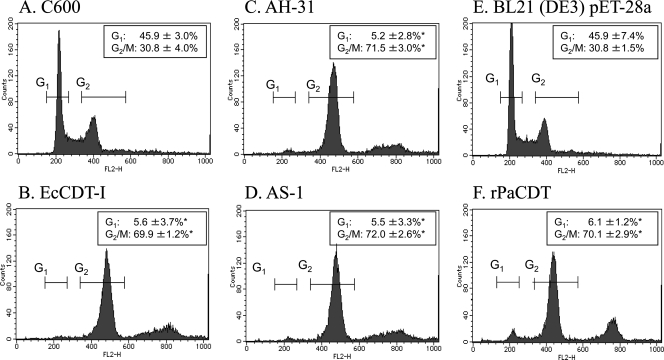
Analysis of CHO cell cycle after treatment with various preparations. The cell cycle distribution of 10,000 cells was determined by flow cytometry, and representative results are shown. The average percentages and the standard deviations of cells in each cell cycle phase calculated with three independent experiments are indicated. CHO cells were unaffected when exposed to lysates of nontoxigenic control E. coli strain such as C600 (A) or BL21(DE3) carrying the empty vector pET-28a (E) cells, but the cells were blocked in the G2/M cell cycle phase when they were exposed to EcCDT-I (B) or PaCDT (C, D, and F). DNA content of CHO cells was monitored by flow cytometry as described in Materials and Methods. The effects of EcCDT-I (B) and PaCDT (C and D) on the CHO cell cycle (G1 and G2/M) were compared to the lysate of E. coli strain C600 (A) used as a negative control. The effect of rPaCDT (F) on CHO cell cycle (G1 and G2/M) was compared to that of E. coli strain BL21(DE3) carrying the empty vector pET-28a (F). *, P < 0.05 (Student t test, n = 3).

