Fig 3.
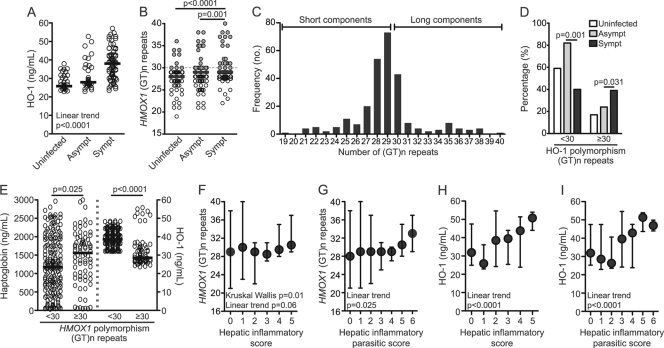
HMOX1 gene polymorphisms influence susceptibility to malaria. (A) The plasma HO-1 concentrations in noninfected individuals and those with asymptomatic or symptomatic malaria were compared. (B) The numbers of GT repeats in the HMOX1 gene in noninfected individuals and those presenting with asymptomatic or symptomatic malaria were also compared. Gray dots represent individuals carrying ≥30 GT repeats in the HMOX1 gene. (C) Frequency of the different number of (GT)n repeats in the study population. (D) Percentage of noninfected individuals (white bars) and individuals with asymptomatic (gray bars) or symptomatic (black bars) malaria carrying the short or long (GT)n repeats in the HMOX1 gene. (E) Plasma levels of Hp (left) and HO-1 (right) in individuals with short or long (GT)n repeats in the HMOX1 gene (data were compared using a Mann-Whitney test). (F and G) The associations between the number of (GT)n repeats in the HMOX1 gene and the degree of liver damage or disease severity were estimated by the hepatic inflammatory and hepatic inflammatory parasitic scores. (H and I) Plasma HO-1 concentrations in relation to the malaria severity scores. In panels F to I, the symbols represent the median values and the whiskers represent maximum and minimum values. The differences between the groups illustrated in panel D were compared using a chi-square exact test and Fisher's exact test (only the P values from Fisher's exact test are shown). The data from the other panels were compared using the Kruskal-Wallis test with Dunn's multiple comparisons or linear trend analysis. P values are shown in each panel.

