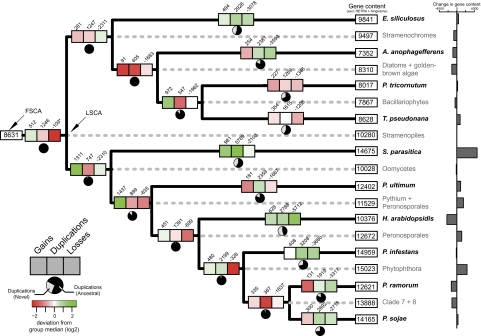
FIG. 2.—
Projected evolutionary events on the Stramenopile phylogeny. The number of evolutionary events, that is, gene gains, duplications, and losses, are projected onto each branch of the phylogeny. Pie charts indicate the relative contribution of novel or ancestral OGs to the total number of duplications. The heat map highlights the deviation of the number of events from the median of the class (gains, duplications, or losses). Predicted gene content of the ancestors, LSCA and first Stramenopile common ancestor, as well as of the extant taxa (excluding singletons and transposable elements) is displayed in terminal boxes, whereas the calculated change in gene content, that is, change in the number of genes per branch, is shown by bar charts.

