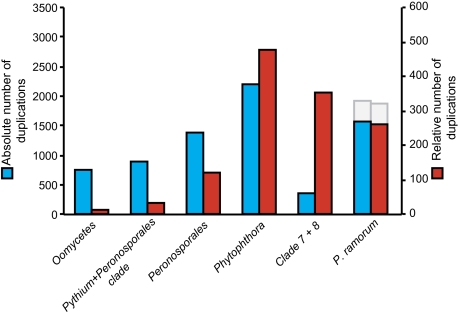
FIG. 3.—
Absolute and relative numbers of duplication events for P. ramorum and all its ancestors. The absolute number of duplications is displayed in blue, whereas the relative number of duplications (per unit of time) is shown in red. The gray bar represents the abundance of duplications (absolute and relative) including duplications occurring in lineage-specific OGs in P. ramorum.

