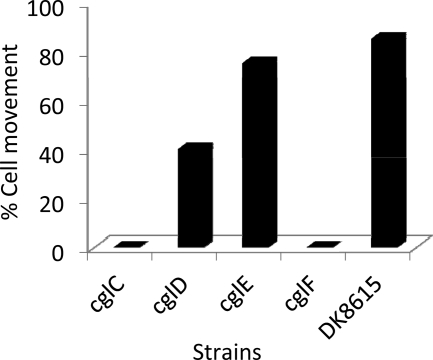
Fig 4.
Single-cell motility analysis of cgl mutants. Time-lapse microscopy was conducted for 30 min with micrographs taken every 30 s. For each strain at least 50 individual cells were visually tracked. A single discernible cell movement over the duration of the 30 min movie was sufficient for a positive score. Isogenic strain sets contain a ΔpilQ mutation and strain numbers are listed in Fig. 3 legend.

