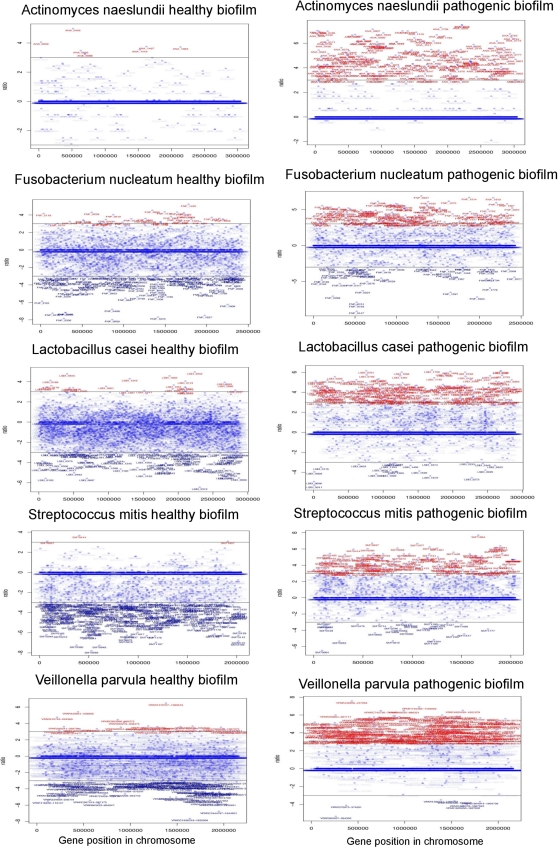
Fig 1.
Expression profile of the ORFs comparing biofilm and free-living bacteria gene expression in healthy and pathogenic biofilms. A line at −3 and +3 shows the cutoff selected for the experiments (8-fold difference). In red are the genes whose ratios of gene expression were higher than 3 in the biofilm versus planktonic phase. In dark blue (bottom of the graph) are the genes whose ratios of gene expression were lower than −3 in the biofilm versus planktonic phase (were upregulated in the planktonic phase).

