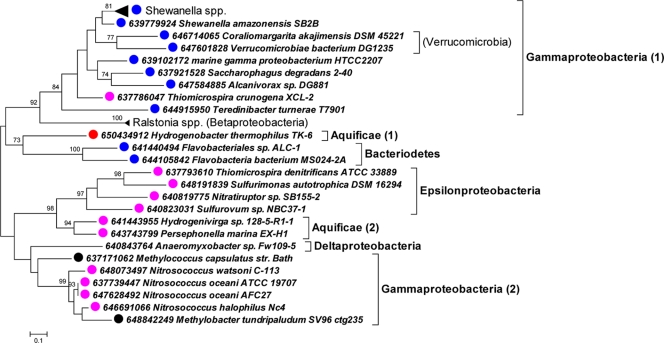
Fig 6.
Phylogenetic analysis of amino acid sequences predicted from genes orthologous to Tcr_1315. The maximum likelihood method was implemented in MEGA5 to create an unrooted tree (32). Bootstrap values of >70% are displayed above the branches. Taxa are labeled with dots as follows: blue, marine; red, autotroph; purple, marine autotroph; black, methylotroph or methanotroph.

