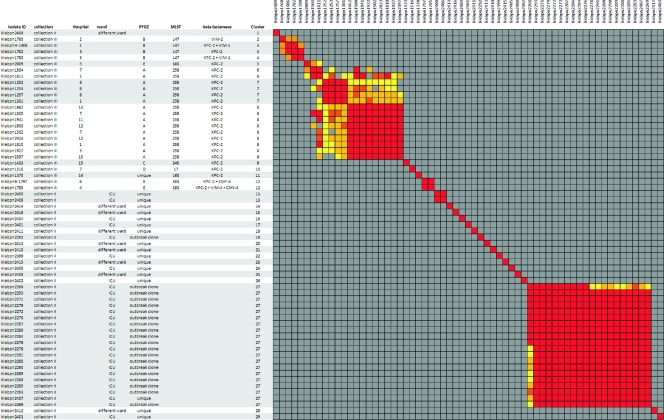
Fig 2.
Similarity matrix of the K. pneumoniae isolates from collection II and collection III. Red clusters indicate isolates that are indistinguishable based on the cutoff. The gray areas indicate isolates that are unrelated based on the similarity threshold. The isolates that are potentially related are indicated by yellow to orange. The indicated cluster numbers represent the clusters with indistinguishable isolates based on the cutoff.

