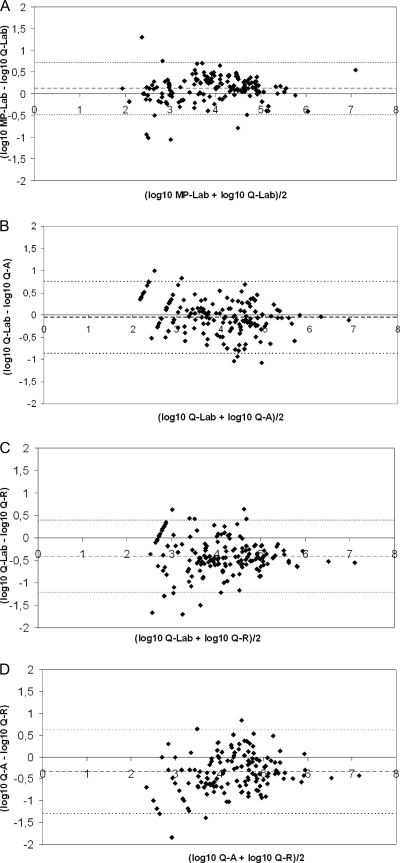
Fig 1.
Bland-Altman analysis of EBV DNA loads positive by both technologies. (A) Comparison of extraction robots. MagNA the plus the laboratory-developed PCR on a LightCycler instrument (MP-Lab) was compared with QIAcube plus the laboratory-developed PCR on a LightCycler instrument (Q-Lab). A total of 159 samples were used. (B) Comparison of Q-Lab with Q-A (QIAcube plus the artus EBV RG PCR kit on a Rotor-Gene instrument). A total of 154 samples were used. (C) Comparison of Q-Lab with Q-R (QIAcube plus the Argene EBV R-gene quantification kit on a Rotor-Gene instrument). A total of 156 samples were used. (D) Comparison of Q-A and Q-R. A total of 151 samples were used. The bold line represents the mean differences; the thin lines represent the mean ± 1.96 standard deviation.

