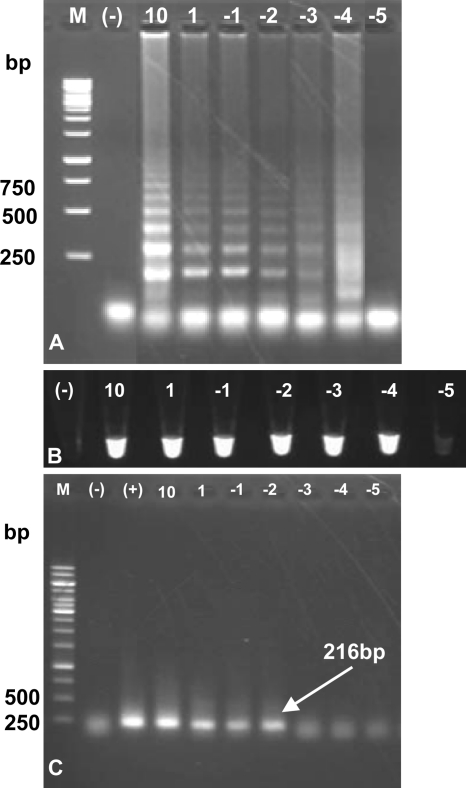
Fig 5.
Sensitivity assessment of the LAMP assay for O. viverrini using serial dilutions of genomic DNA template and comparison with PCR (performed using outer primers F3 and B3). (A and B) Sensitivity analysis of the LAMP assay by visualization on 1.5% agarose stained with ethidium bromide (A) or under UV light after the addition of SYBR green I (B). (C) Sensitivity analysis of the conventional PCR revealed on 1% agarose (arrow indicates a 216-bp DNA fragment at the highest template dilution for PCR performance). Lanes: M, 1-kb ladder marker (numbers on the left are sizes in base pairs); (-), no-DNA template (water added) as a negative control; (+), 100 ng template (positive control), 10, 10 ng; 1, 1 ng; −1: 100 pg; −2, 10 pg; −3, 1 pg; −4, 100 fg; −5, 10 fg.

