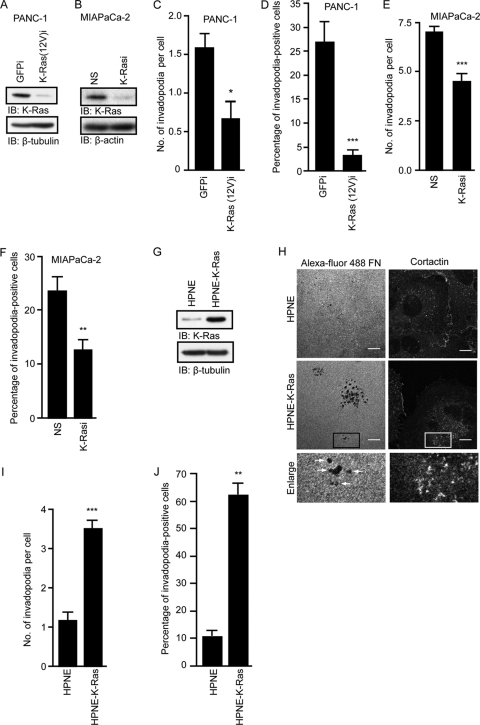
Fig 2.
Activated K-Ras growth transformation of human pancreatic cells is associated with increased invadopodium activity. Expression of K-Ras(12V)-specific shRNA [K-Ras(12V)i] in PANC-1 cells and total K-Ras-specific shRNA (K-Rasi) in MIA PaCa-2 cells decreases invadopodium activity. (A) Western blot analysis of lysates from PANC-1 cells expressing GFP control shRNA or K-Ras(12V)-specific shRNA. (B) Western blot analysis of lysates from MIA PaCa-2 cells expressing nonspecific (NS) shRNA or total K-Ras-specific shRNA. (C and D) Expression of K-Ras(12V)-specific shRNA in PANC-1 cells decreases the number of invadopodia per cell (C) and the percentage of invadopodium-positive cells (D). Statistically significant differences between GFP shRNA- and K-Ras(12V)-specific shRNA-expressing cells, as determined by a Mann-Whitney U test, are indicated by a single asterisk (P value < 0.05) or three asterisks (P value < 0.005). (E and F) Expression of K-Ras-specific shRNA in MIA Paca-2 cells decreases the number of invadopodia per cell (E) and the percentage of invadopodium-positive cells (F). Statistically significant differences between NS shRNA- and K-Ras-specific shRNA-expressing cells, as determined by a Mann-Whitney U test, are indicated by two asterisks (P value < 0.01) or three asterisks (P value < 0.005). (G) Western blot analysis to verify K-Ras(12D) expression in HPNE-K-Ras cells. (H) Confocal images of HPNE and HPNE-K-Ras cells. Cells were seeded on coverslips coated with Alexa Fluor 488-coupled fibronectin and stained with antibody against cortactin. Boxed areas of interest (illustrating staining of cortactin in degraded areas of the matrix) are enlarged (2×). Scale bars, 10 μm. (I and J) Expression of K-Ras(12D) increases the number of invadopodia per cell (I) and the percentage of invadopodium-positive cells (J). Statistically significant differences between HPNE and HPNE-KRAS cells, as determined by a Mann-Whitney U test, are indicated by two asterisks (P value < 0.01) or three asterisks (P value < 0.0005). Ten fields (containing 15 to 40 cells each) per condition were used for all quantitation. Data are represented in graphs as means ± standard errors of the mean (SEM). Data shown are representative of two or more independent experiments.

