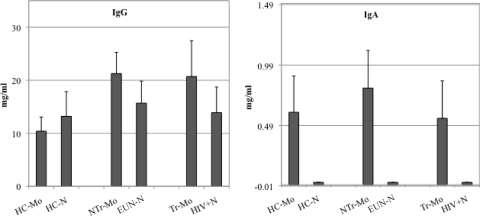
Fig 1.
Quantification of IgG and IgA in serum samples from all mother-baby pairs. The left panel shows serum IgG quantification. The right panel shows serum IgA quantification. Bars represent immunoglobulin concentrations in HIV healthy control unexposed mothers and in their babies (HC-Mo and HC-N, respectively), nontransmitter mothers and their babies (NTr-Mo and EUN-N, respectively), and transmitter mothers and their babies (Tr-Mo and HIV+N).

