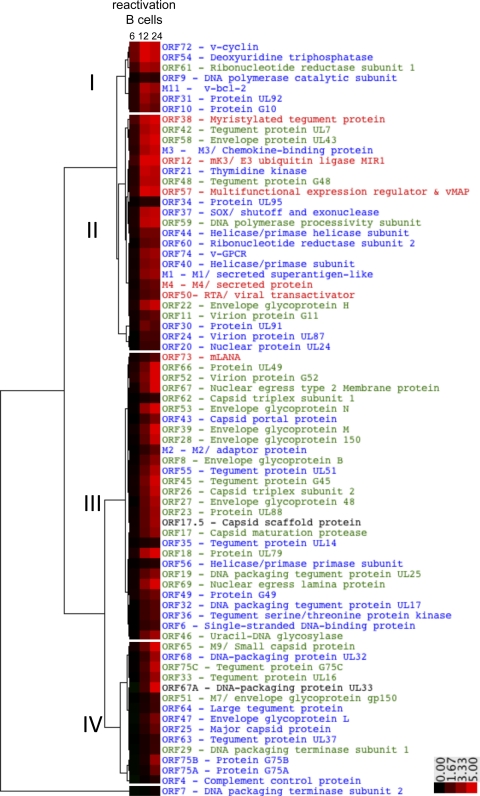
Fig 3.
Temporal cascade of lytic gene expression upon TPA-stimulated reactivation from latent B cells. The median log2-normalized probe signal within an ORF at each time point (6, 12, and 24 h after TPA stimulation) was determined, and hierarchical cluster analysis was performed using the uncentered correlation for the similarity metric calculation and complete linkage for the clustering method in the Cluster program (version 3.0). The clustering was visualized in TreeView (version 1.1.4r3) and revealed four major clusters of gene expression during reactivation induced by TPA stimulation of the latent HE2 B cell line. The average Silhouette score for the five clusters was 0.64, and individual cluster scores were 0.63 (I), 0.60 (II), 0.73 (III), 0.58 (IV), and 1.0 (single-gene outlier ORF7). ORF27 and ORF65 had the lowest Silhouette scores of cluster II and IV genes, respectively. The transcript abundance at each time point for each ORF is represented as a box in the heat map. The black-to-red scale indicates increasing transcript abundance. The color-coded text labels reflect classifications of genes as IE (red), E/E-L (blue), or L (green), based on prior de novo productive infection arrays described elsewhere (2, 18, 40, 59).

