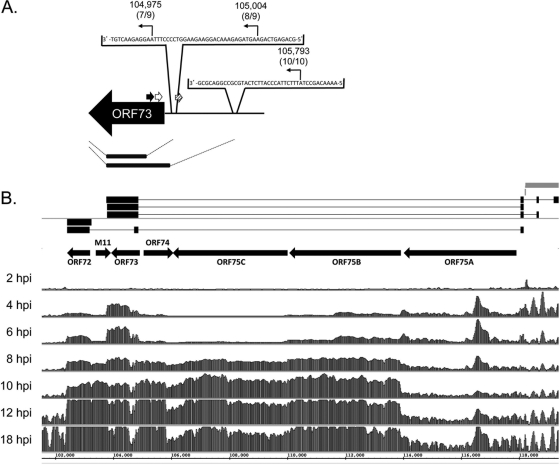
Fig 4.
Tiled array identifies a novel ORF73 transcript and distinct transcript profiles of genes at the right end of the genome during de novo infection. (A) Boundary analysis of ORF73. Arrows indicate positions of 5′ RACE gene-specific primers; black, outer primer; white, inner primer 1; hatched, inner primer 2. Sequencing results mapped the 5′ transcriptional start sites to bp 104,975 for 7/9 clones at 18 hpi of NIH 3T3 fibroblasts, bp 105,004 for 8/9 clones at 12 hpi, and bp 105,793 for 10/10 clones at 4 hpi. (B) Tiled array bar graphs. For each time point indicated, bars represent the mean linear signal ratio (sample/reference RNA) of the three probes that covered each 20-nt interval on the reverse strand of the ORF72-ORF75A genomic regions at the indicated time points for de novo-infected fibroblasts. Gray bars indicate terminal repeats at the right end of the genome. Connected horizontal black boxes are previously reported spliced structures for ORF73 and ORF72 (3, 4, 12). Arrows indicate the orientation of the ORFs.

