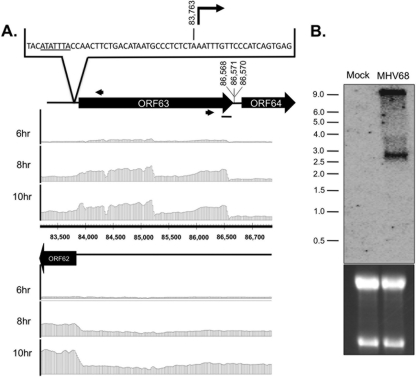
Fig 5.
Characterization of ORF63 transcript structure. (A) Boundary analysis of ORF63. Tiled array bar graphs representing the transcript signal ratio for each strand of the ORF62-ORF64 genomic regions (bp 83,200 to 86,950) are provided at the indicated time points. Black arrows indicate positions of 5′ and 3′ RACE gene-specific primers. Sequencing results mapped the 5′ transcriptional start sites to bp 83,763 (n = 8) at 10 hpi of fibroblasts. Underlined nucleotides represent a TATA box element located (33 bp) upstream of the transcriptional start. Sequencing results for the 3′ transcript end mapped to bp 86,568 (n = 8), 86,570 (n = 1), and 86,571 (n = 1) at 10 hpi of fibroblasts. (B) Northern blot analysis of ORF63 region with strand-specific RNA probe (black bar in panel A) identifies RNA of ∼2.8 kb at 10 hpi of fibroblasts. ORF63 transcript in MHV68-infected cells, consistent with the full-length transcript predicted by tiled array and RACE analysis. Numbers to the left indicate the kilobase sizes of the RNA ladder. 28S and 18S rRNA bands visualized in an ethidium bromide-stained polyacrylamide gel demonstrate equal loading.

