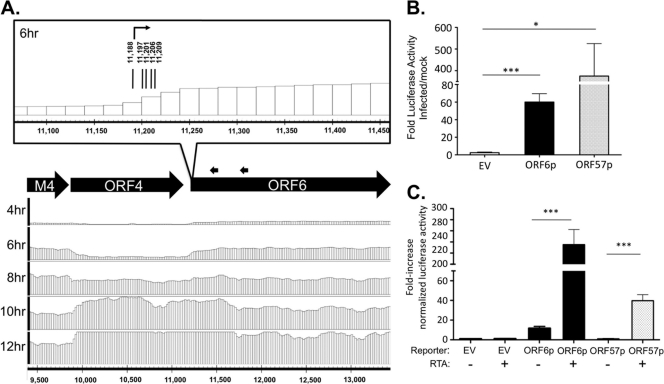
Fig 6.
ORF6 transcription start site and upstream regulatory region predicted by tiled array. (A) Analysis of the 5′ boundary of ORF6. Tiled array bar graphs for transcript signal ratio in the genomic region upstream of and including ORF6 (forward strand, bp 9,500 to 13,400) are provided at the indicated time points. Black arrows indicate positions of 5′ RACE gene-specific primers. As illustrated in the inset of the genomic region, sequencing results mapped the 5′ transcriptional start sites to bp 11,188 (n = 6), 11,197 (n = 1), 11,201 (n = 1), 11,206 (n = 1), and 11,209 (n = 1) at 6 hpi of fibroblasts. (B) Identification of ORF6 promoter activity. The genomic region (9,894 to 11,218 bp) upstream of ORF6 transcription initiation was cloned into the firefly luciferase vector Hsp70-Luc and transfected into NIH 3T12 fibroblast cells prior to infection at an MOI of 5 in triplicate. Bars indicate the fold increase in luciferase activity of infected cells compared to uninfected cells. (C) ORF6 promoter is RTA responsive. HEK 293T cells were cotransfected with the indicated reporter constructs, a Renilla luciferase reporter for normalization, and the lytic transactivator MHV68 RTA. Bar graphs represent luciferase activity relative to that of an empty vector (EV). ORF57p is a previously characterized RTA-responsive promoter (53). Error bars indicate the mean and standard deviation. Significance was determined by Student's t test (*, P < 0.0126; ***, P < 0.0005).

