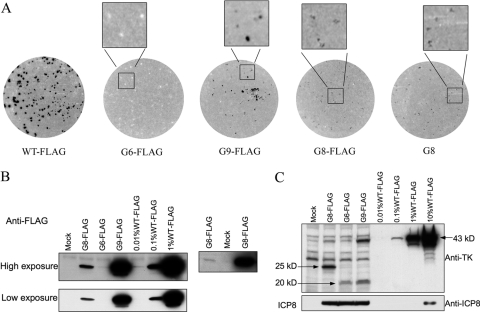
Fig 2.
TK expression in WT and mutant virus-infected cells. (A) Plaque autoradiography showing in situ TK activity in plaques. Black or gray dots represent plaques with TK activity, and white dots represent plaques without detectable TK activity. The enlarged images of selected areas are shown at the top of autoradiographs, and the viruses assayed are indicated below each autoradiograph. (B) (Left) Two exposures (high and low) of IP-Western (FLAG) analysis of full-length TK expression in mock-, mutant-, and WT-infected cells compared to a dilution series of an IP from WT-infected cells (12 hpi, MOI = 10), with the viruses and dilutions used indicated at the top; (right) high exposure of IP-Western (FLAG) analysis of full-length TK expression in G6-FLAG-, mock-, and G8-FLAG-infected cells. (C) Western blot analysis using anti-TK antibody showing full-length as well as N-terminal TK polypeptides in infected cells (top) or using anti-ICP8 antibody (bottom). The samples analyzed were lysates reserved in the experiment whose results are shown in panel B and dilutions of lysates of WT-infected cells, with the viruses and dilutions used indicated at the top. The arrows point to bands corresponding to N-terminal (20-kDa and 25-kDa) or full-length (43-kDa) TK polypeptides. The molecular masses indicated were interpolated from molecular mass markers run alongside the samples.

