
Fig 6.
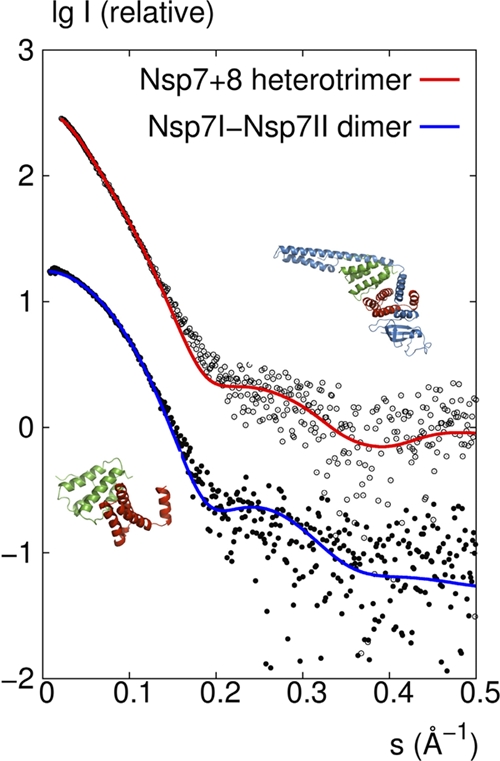
SAXS investigations of the FCoV Nsp7+8 complex and Nsp7 in solution. Comparison of the experimental SAXS profile (empty circles) with a CRYSOL-calculated scattering curve (red) of the heterotrimer model consisting of Nsp7I, Nsp7II, and Nsp8 derived from the crystal structure and comparison of the SAXS data (filled circles) with the calculated scattering curve (blue) of the dimer model consisting of Nsp7I and Nsp7II, as found in the crystal structure of the heterotrimer.