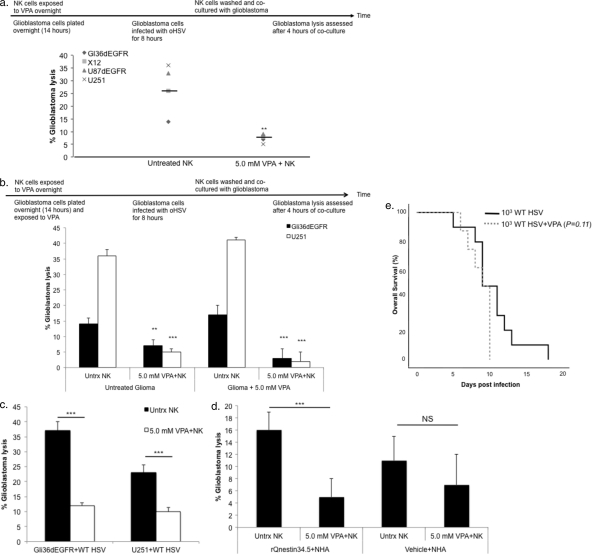
Fig 5.
NK cell-mediated killing of oHSV-infected glioblastoma cells is suppressed by VPA. (a) Enriched human NK cells were exposed to 5.0 mM VPA overnight. Gli36dEGFR, U87dEGFR, and U251 glioblastoma cell lines and X12 “stem-like” glioblastoma cells were plated (104 cells/well); 14 h later, glioblastoma cells were washed and infected with rQNestin34.5 (MOI of 1.0) for 8 h prior to coculture with NK cells. VPA-treated NK cells were washed and cocultured with infected glioblastoma cells at an effector/target ratio of 12:1 in the presence of IL-15 (100 ng/ml), added immediately before coculture with infected cells. At 4 h later, glioblastoma lysis was assessed. The percentage of glioblastoma lysis for each cell type is plotted for NK cells with or without VPA. Horizontal bars indicate the mean values for individual events. (b) Enriched human NK cells were exposed to 5.0 mM VPA overnight. Gli36dEGFR or U251 cells were plated (104 cells/well) and were either left untreated (Untrx) or exposed to 5.0 mM VPA overnight. At 14 h later, glioblastoma cells were washed and infected with rQNestin34.5 (MOI of 1.0) for 8 h prior to coculture with NK cells. VPA-treated NK cells were washed and then cocultured as described for panel a. (c) Gli36dEGFR and U251 cells were plated (104 cells/well) and infected with wild-type HSV (MOI of 1.0) for 8 h. Enriched human NK cells were treated with VPA, washed, and cocultured with infected glioblastoma as described for panel a. (d) Normal human astrocytes were plated (104 cells/well) and infected with rQNestin34.5 (MOI of 1.0) or mock infected for 8 h. Enriched human NK cells were treated with VPA, washed, and cocultured with infected glioblastoma as described for panel a. (e) Glioblastoma-free athymic mice were either treated with vehicle or subjected to two VPA treatments at 12-h intervals the day before wild-type HSV inoculation. The following day, wild-type HSV (103 PFU) was inoculated intracranially and mice were monitored for the onset of neurological symptoms. For panels a to d, a t test was used to compare percentages of glioblastoma lysis in the presence or absence of VPA. For panel e, a log-rank test was used to compare animal survival rates. **, P < 0.01; ***, P < 0.001. Error bars represent ± standard deviations.

