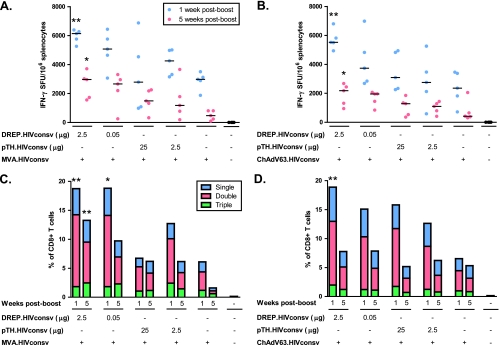
Fig 4.
CD8+ T cell responses following DNA prime and viral vector boost. Mice were immunized i.d. with EP with the indicated dose and boosted 9 weeks later with 5 × 10⁶ PFU MVA.HIVconsv (A and C) or 7 × 10⁹ vp ChAdV63.HIVconsv (B and D). Spleens were collected and analyzed at 7 days and 5 weeks postboost. HIVconsv-specific CD8+ T cell responses were assessed with IFN-γ ELISpot (A and B) and by ICS for IFN-γ, TNF-α, and IL-2 (C and D). Single, double, and triple denote how many of these cytokines the individual CD8+ T cells produced. Each group consisted of 5 mice. Results are displayed as group medians. The Kruskal-Wallis nonparametric test followed by Dunn's posttest was used to compare all primed groups with the corresponding nonprimed group at 7 days or 5 weeks postboost. In panels C and D, the total percentage of cytokine-positive cells was used for statistical comparison. *, P < 0.05; **, P < 0.01.

