Fig 1.
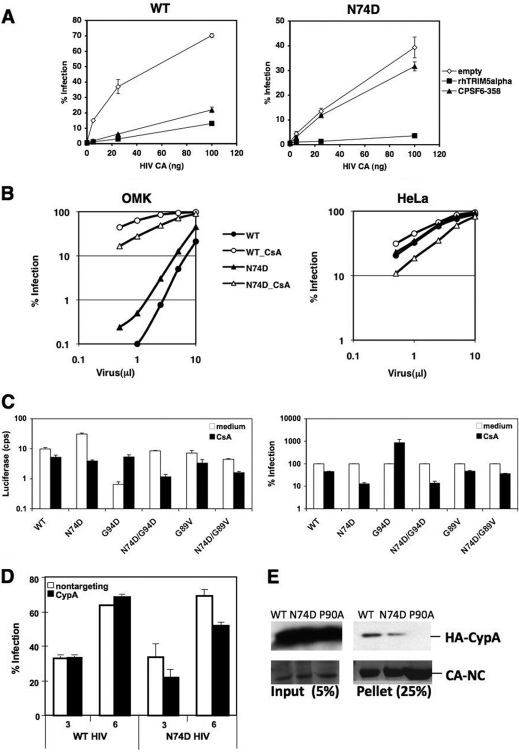
Sensitivity of N74D HIV-1 to TRIMs and CsA. (A) HeLa cells expressing empty vector, CPSF6-358, or rhTRIM5α were infected in duplicate with various amounts of WT HIV-1 or the N74D mutant (as measured by p24 enzyme-linked immunosorbent assay [ELISA]) encoding the HSA gene in place of nef and pseudotyped with vesicular stomatitis virus G (VSV-G) and assayed for HSA expression 48 h later. (B) Owl monkey kidney (OMK) or HeLa cells incubated with or without 2.5 μM CsA were infected with different volumes of WT or N74D HIV-1 encoding red fluorescent protein (RFP) and pseudotyped with VSV-G and assayed by a fluorescence-activated cell sorter (FACS) for RFP-positive cells after 48 h. (C) HeLa cells were infected with WT HIV-1 or N74D, G94D, N74D/G94D, G89V, and N74D/G89V mutants encoding the luciferase gene and pseudotyped with VSV-G (HIV-luc/VSV-G) in the presence or absence of 2.5 μM CsA and assayed for luciferase expression 48 h later. Infectivity data shown are absolute luciferase values (left) and normalized values for infectivity in the absence of CsA (right) cps, counts per second. (D) Endogenous CypA expression in HeLa cells was knocked down by small interfering RNA (siRNA) prior to infection with the WT or N74D HIV-1 encoding RFP and pseudotyped with VSV-G. Control cells were treated with nontargeting siRNA. Cells were infected with increasing microliters of virus, and infection was measured 48 h later by flow cytometry. A Western blot of cell lysates harvested on the day of infection was performed to verify protein knockdown. (E) WT, N74D, and P90A CA-NC complexes were incubated with 293T cell extracts expressing CypA tagged with hemagglutinin (HA). Reaction mixtures were isolated after centrifugation through 50% sucrose and probed by a Western blot with anti-HA antibodies (top panels). Coomassie blue staining of total protein is shown in the bottom panels. The results are representative of two independent experiments. Error bars in panels A and C represent the standard deviations of duplicate wells of an experiment.

