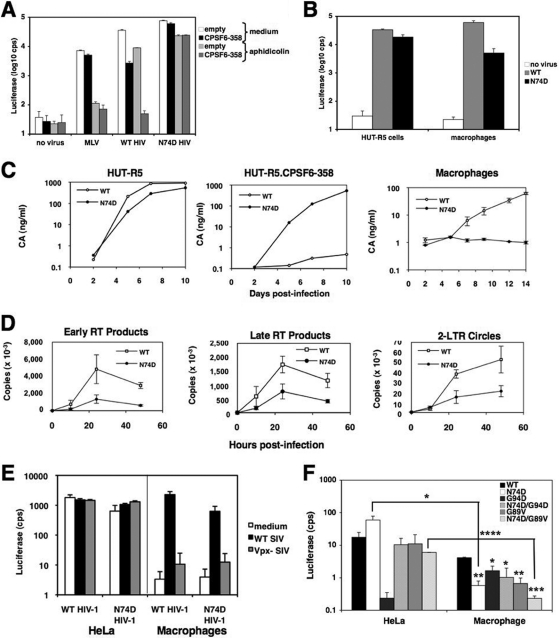
Fig 4.
Infection of macrophages by the N74D mutant is inhibited prior to or at reverse transcription in a Vpx-independent manner. (A) HeLa and HeLa-CPSF6-358 cells were incubated with culture medium or with murine leukemia virus (MLV)-luc/VSV-G, WT HIV-luc/VSV-G, or N74D HIV-luc/VSV-G in the presence or absence of 2 μg/ml aphidicolin. Luciferase expression was measured 48 h later. (B) HUT-R5 cells and primary human macrophages were infected in duplicate with WT or N74D HIV-luc/VSV-G and analyzed for luciferase activity after 48 h. Representative of 4 independent experiments, using 3 donors for macrophages. (C) HUT-R5 cells, HUT-R5-CPSF6-358 cells, and macrophages were infected with WT HIV-1NL4-3/BaL (a gift from N. Landau) or N74D HIV-1NL4-3/BaL. CA was measured in the culture supernatants by p24 ELISA. Macrophages were infected in duplicate. Representative of 2 independent experiments, using 2 donors for macrophages. (D) Macrophages were infected in duplicate with WT or N74D HIV-luc/VSV-G and lysed at different time points. Early (RU5) and late (gag) RT products, as well as 2-LTR circles, were measured by qPCR. Viral DNA copies are expressed per μg of total DNA obtained from the cells. Representative of 3 independent experiments, using 2 donors. (E) HeLa cells and macrophages were incubated with culture medium or equal MOIs of WT or Vpx-negative SIV-enhanced green fluorescent protein (EGFP)/VSV-G, as determined in HeLa cells, for 4 h. Then the cells were infected with equal MOIs of WT or N74D HIV-luc/VSV-G, as determined on Ghost cells. Luciferase activity was measured 48 h postinfection. Error bars represent standard deviations of duplicates. Representative of 3 independent experiments. (F) HeLa cells or macrophages were infected with the same amounts of WT HIV-luc/VSV-G or the N74D, G94D, N74D/G94D, G89V, or N74D/G89V mutant and analyzed for luciferase activity after 48 h. Representative of 4 independent experiments. Statistical significance values of panel F were calculated by using Student's two-sided t test. Asterisks directly above bars indicate differences between WT and mutant infections in a given cell type, whereas asterisks above lines indicate differences in infectivity for the same virus between cell types. ****, P < 0.0001; ***, P < 0.001; **, P < 0.01; *, P < 0.05. Error bars in all panels represent standard deviations of duplicate wells of an experiment.

