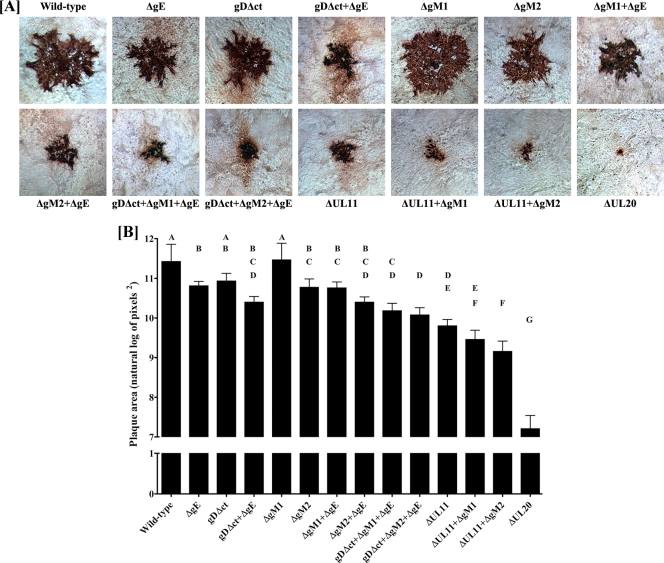
Fig 2.
Plaque phenotypes of wild-type and mutant viruses. (A) Confluent Vero cell monolayers were infected with each virus at an MOI of 0.001, and viral plaques were visualized at 48 hpi by immunohistochemistry as described in Materials and Methods. (B) Thirty different viral plaques were randomly selected, imaged, measured, and statistically analyzed as described in Materials and Methods. Natural log-transformed data depicted as bar graphs for each virus are shown as geometric means with 95% confidence intervals. Tukey's test was performed after one-way analysis of variance to examine pairwise differences between the means for each of the 14 viruses. Viruses that were significantly different from each other (P ≤ 0.05) are labeled with different capital letters (A, B, C, D, E, F, and G).

