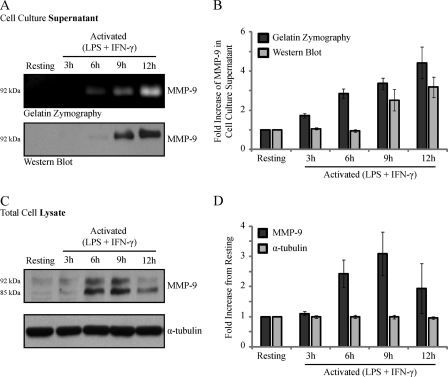
FIGURE 1.
Analysis of MMP-9 levels in the cell culture supernatants and total cell lysates of resting and LPS/IFN-γ-activated RAW 264.7 cells. RAW 264.7 cells were stimulated with LPS/IFN-γ for 3, 6, 9, and 12 h or left unstimulated. After the indicated time points, the cell culture supernatants were collected, and the cells were lysed and subjected to gelatin zymography or immunoblotting. Shown are the gelatin zymogram and immunoblot (A) and densitometric analysis (B) of macrophage cell culture supernatants for secreted MMP-9. Also shown are Western blot (C) and densitometric analysis (D) of macrophage total cell lysates for levels of intracellular MMP-9 and α-tubulin, used as a loading control. Error bars, S.E.

