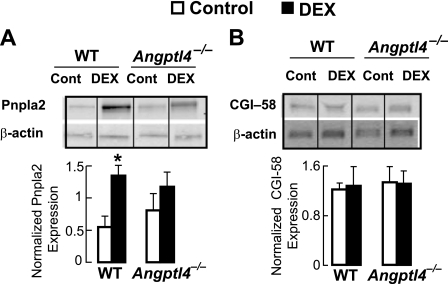
FIGURE 6.
A, immunoblots probing for the levels of Pnpla2 in epididymal WAT explants taken 24 h after DEX treatment, showing a significant increase in expression after DEX treatment in WT mice but not in Angptl4−/− mice. The intensity of bands quantified from five separate blots per treatment condition was expressed as the ratio of Pnpla2 normalized to actin (*, p < 0.05 versus fed; **, p < 0.05 versus WT control). B, expression of CGI-58 was also measured by immunoblot in WAT of the same animals. No differences in expression were observed in response to DEX treatment in either genotype. Data are the mean band intensities measured from four separate blots per treatment condition. Error bars, S.E.

