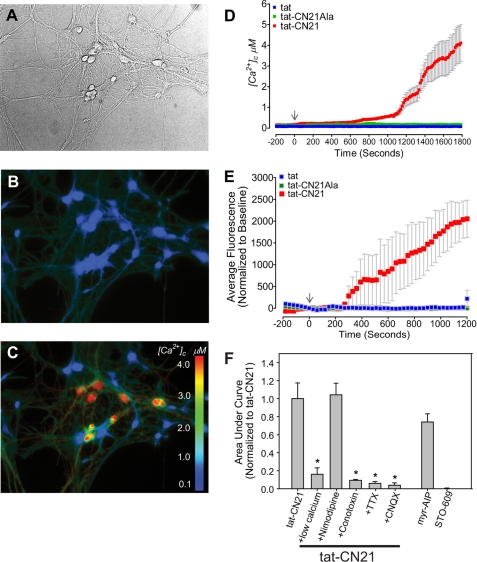
FIGURE 4.
Calcium dysregulation with CaMKII inhibition in hippocampal neurons. A, representative bright field; B and C, fluorescent images of Fura-2FF-loaded hippocampal neurons. B, before treatment; C, after treatment with 10 μm tat-CN21. D, cytoplasmic calcium levels ([Ca2+]c) (mean ± S.E.) before and after application of 10 μm tat-CN21, tat-CN21Ala, or tat. E, neuronal intracellular calcium levels (mean ± S.E.) before (−300 to 0 s) and after (0 to 1200 s) application of 10 μm tat-CN21, tat-CN21Ala, or tat, as measured by Fluo-4 (n = 4). F, average integral of fluorescent intensity from 0 to 1200 s in E (mean ± S.E., n = 3–6) with application of CaMKII inhibitors with and without pharmacological blockers of neuronal excitability. The integral was normalized to the calcium influx observed with application of 10 μm tat-CN21. *, p < 0.05 compared with tat-CN21 alone (one-way ANOVA, post hoc Dunnett's test).

