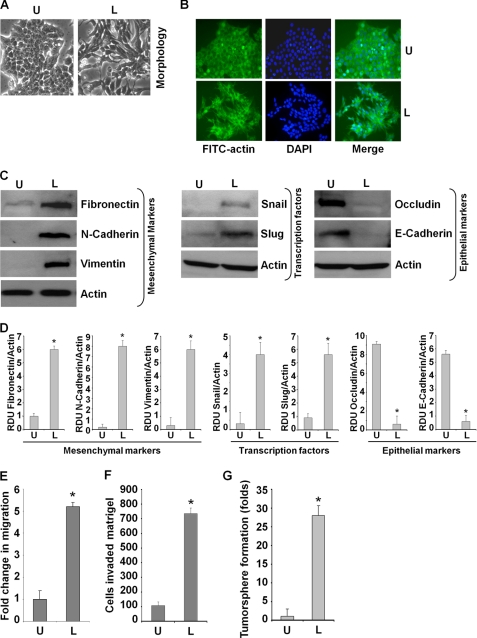
FIGURE 1.
Leptin induces epithelial-mesenchymal transition, tumorsphere formation, migration, and invasion of breast cancer cells. A, MCF7 cells were serum-starved for 16 h followed by treatment with 100 ng/ml leptin (L) or were untreated (U) for 3 days. Morphological changes associated with EMT are shown in phase-contrast images. The presence of spindle-shaped cells, increased intercellular separation, and pseudopodia were noted in treated cells but not in untreated cells. B, MCF7 cells were treated as in A. Fluorescent confocal microscopy showed the alterations in the cytoskeleton by leptin treatment. Reorganization of actin into pseudopodia and stress fibers were noted in leptin-treated cells. Nuclei were visualized with DAPI staining. C, MCF7 cells were treated with 100 ng/ml leptin (L) or were untreated (U). Total lysates were immunoblotted for fibronectin, N-cadherin, vimentin, Snail, Slug, Occludin, and E-cadherin expression levels. Leptin treatment increased fibronectin, N-cadherin, vimentin, Snail, and Slug expression, whereas E-cadherin and occludin expression was decreased. Actin was used as control. D, densitometric analysis was performed on multiple blots for each target protein. The histogram is the mean of densitometric analysis showing relative density units (RDU) of the Western blot signal for target proteins normalized to actin. *, p < 0.005 compared with untreated controls. E, MCF7 cells were subjected to the scratch-migration assay in the absence (U) or presence of 100 ng/ml leptin (L) for 24 h. Fold-change in migration is shown in bar graphs. *, p < 0.005, compared with untreated controls. F, MCF7 cells were cultured in Matrigel invasion chambers followed by treatment with leptin for 24 h. The number of cells that invaded through the Matrigel was counted in five different regions. The slides were blinded to remove counting bias. The results show mean of three independent experiments performed in triplicate. *, p < 0.005 compared with untreated controls (U). G, MCF7 cells were subjected to tumorsphere formation in the absence (U) or presence of 100 ng/ml leptin (L) as indicated. Number of tumorsphere was counted in five different views under a microscope. The results are presented as fold-change with untreated. *, p < 0.005, compared with untreated controls.

