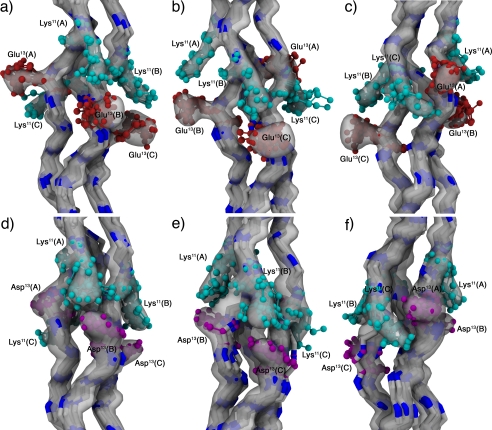
FIGURE 6.
NMR ensembles. a–c, KGE ensemble. d–f, KGD ensemble. Interactions between the charged residues in chains A-B (a and d), B-C (b and e), and C-A (c and f) are highlighted. The reweighted atomic density for each ensemble (33) is depicted as a semitransparent surface at a value of 40%, and 10 representative structures are shown as a backbone trace with the lysine (cyan), glutamic acid (red), and aspartic acid (purple) residues depicted in a cpk model. Amino acids are labeled using their three-letter code, sequence position, and chain (A, leading chain; B, middle chain; and C, lagging chain). Images were generated using vmd-xplor (34).

