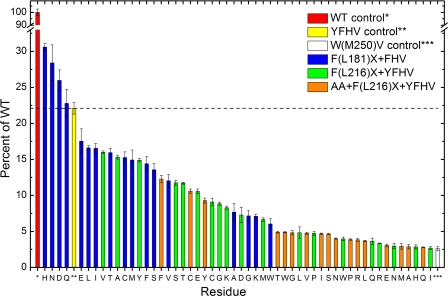
FIGURE 4.
B branch quinone reduction in mutant RCs. Yields of B side P+QB− formation from time-resolved assays of mutant RCs relative to signals from wild-type RCs are shown. Signals from the YFHV (yellow) and W(M250)V (white) RCs serve as benchmark controls. Error bars reflect variability in replicate spectroscopic screening measurements.

